Table of contents
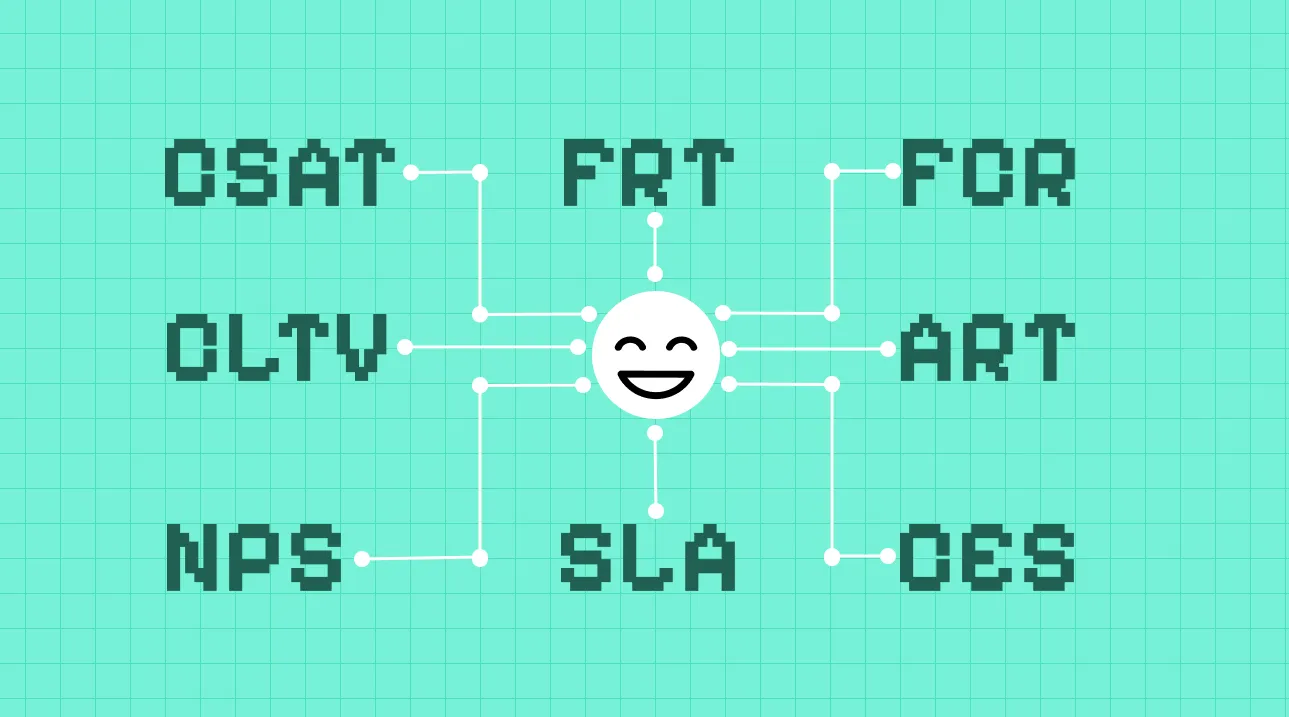
- Customer Service Metrics: Customer Support Metrics & Performance KPIs
- Quick Comparison: Top Customer Service Metrics
- Customer Experience & Sentiment Metrics
- Operational & Efficiency Metrics
- Business & Retention Metrics
- Common mistakes to avoid when tracking customer service metrics
- How Responsly Helps You Measure & Improve
- Conclusion
Customer Service Metrics: Customer Support Metrics & Performance KPIs
Customer service metrics are the quantitative measures that track the performance, quality, and efficiency of your support operations. This guide is for CX leaders, support managers, and product teams who need to know not just which KPIs to track (sometimes called customer support metrics or customer service performance metrics), but how to calculate each one, what a good score actually looks like, and how to act on it. Below you’ll find the 12 most important customer service metrics for 2026—across sentiment, operations, and revenue—each with its formula, a worked example, and a realistic benchmark. For a broader overview of the fundamentals, see our guide on what is customer service and how to improve it.
Quick Comparison: Top Customer Service Metrics
Before diving into the detailed formulas and strategies, here is a high-level comparison of the key customer service metrics every support team should understand.
| Metric | Full Name | What It Measures | Typical target | Best For |
|---|---|---|---|---|
| CSAT | Customer Satisfaction Score | Short-term happiness with a specific interaction | 75–85%+ | Measuring immediate satisfaction after a ticket or chat. |
| NPS | Net Promoter Score | Long-term loyalty and likelihood to recommend | >30 good, >50 excellent | Predicting growth and measuring overall brand sentiment. |
| CES | Customer Effort Score | Ease of resolving an issue | 5.5+ on a 7-point scale | Reducing friction and predicting churn. |
| FCR | First Contact Resolution | Efficiency of solving issues in one go | ~70–75% | Improving customer experience by respecting their time. |
| FRT | First Response Time | Speed of initial acknowledgement | <1 min chat, <1 hr email | Setting the right tone for support interactions. |
| ART | Average Resolution Time | Total time to close a ticket | Lower is better; trend it | Assessing team efficiency and complexity of issues. |
| SLA | Service Level Agreement | Compliance with promised response times | 95%+ | Ensuring reliability and trust. |
| CLTV | Customer Lifetime Value | Total revenue from a customer | Higher is better; > 3× CAC | Connecting support quality to business revenue. |
Benchmarks are typical industry targets and vary by sector, channel, and customer segment—use them as a starting reference, then set your own baseline.
Customer Experience & Sentiment Metrics
These metrics focus on how your customers feel about your brand and their interactions with you. They are often measured using online survey tools and direct feedback.
1. Net Promoter Score (NPS)
Net Promoter Score (NPS) is the gold standard for measuring long-term customer loyalty. Originally developed by Bain & Company, NPS asks a broader question about the customer’s overall relationship with your brand compared to transactional metrics.
The Question: “On a scale of 0-10, how likely are you to recommend [Company] to a friend or colleague?”
- Formula:
- Worked example: Out of 200 responses, 120 are promoters (60%) and 30 are detractors (15%). Your NPS is:
What’s a good score? Any score above 0 means you have more promoters than detractors. Above 30 is good, and 50+ is considered world-class—though benchmarks vary widely by industry.
Why it matters: High NPS correlates strongly with organic growth. It helps you identify your brand advocates and those at risk of churning. You can easily measure this using a dedicated NPS survey template, and you can learn the full method in our how to calculate NPS guide.
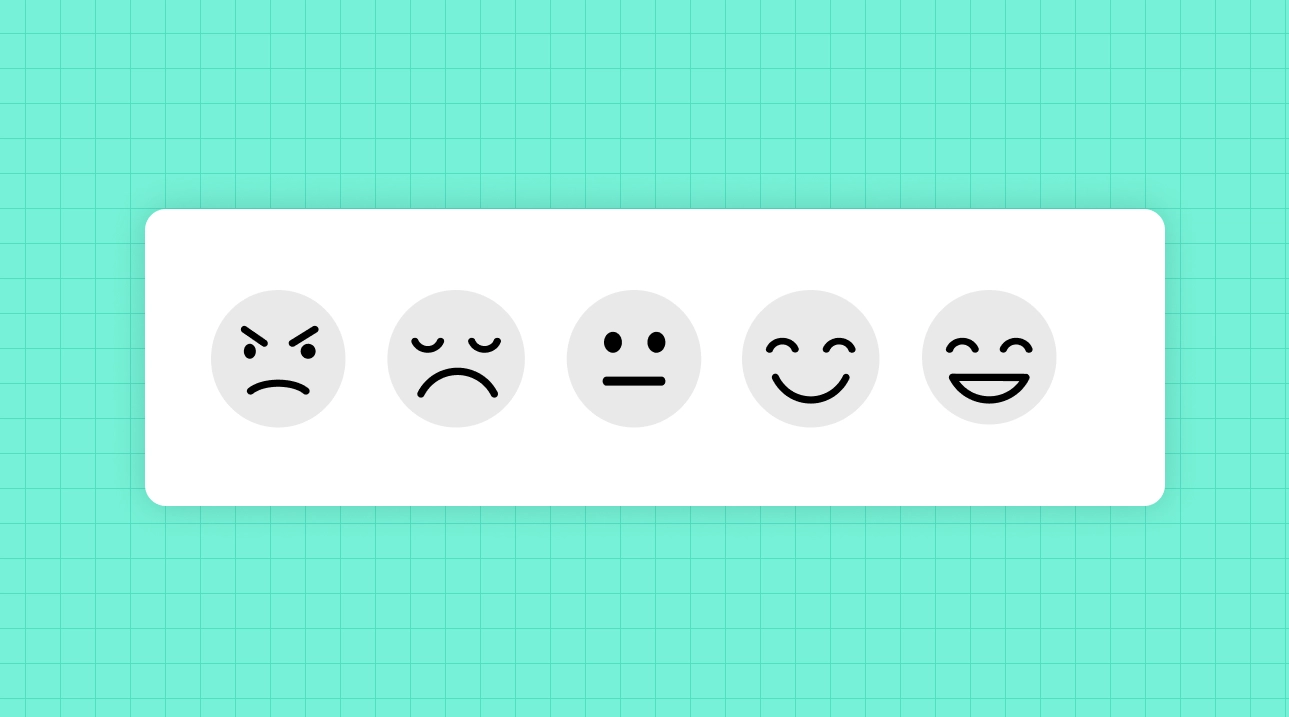
2. Customer Satisfaction Score (CSAT)
CSAT measures customer satisfaction with a specific product, service, or support interaction. It is typically sent immediately after a ticket is closed.
The Question: “How satisfied were you with your experience today?” (Scale of 1-5 or 1-7)
- Formula:
- Worked example: If 85 of your 100 respondents rate you 4 or 5 out of 5:
What’s a good score? A CSAT of 75–85% is solid for most support teams; consistently above 90% is excellent.
Why it matters: It provides immediate feedback on support quality. If your CSAT drops, you know instantly that something in your process or team performance has changed. To go deeper, pick the right wording from our best customer satisfaction survey questions, and for a multi-attribute view, see the Customer Satisfaction Index (CSI).
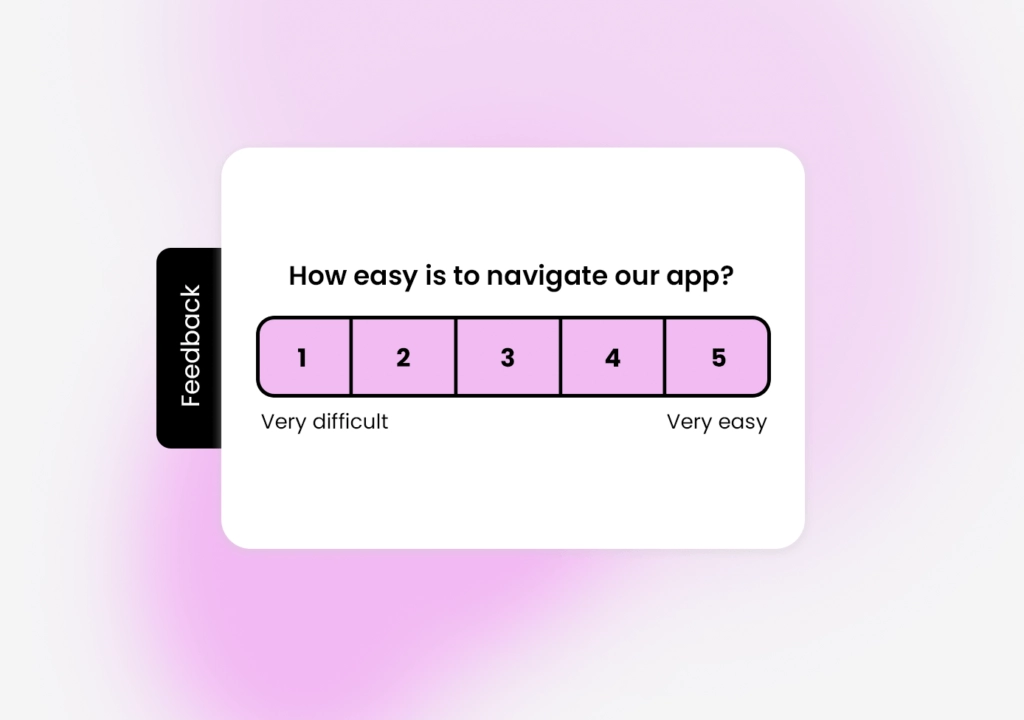
3. Customer Effort Score (CES)
Customer Effort Score operates on the premise that customers value an easy experience more than a “delightful” one.
The Question: “To what extent do you agree with the following statement: [Company] made it easy for me to handle my issue.”
- Formula:
- Worked example: 50 customers respond on a 1-7 “easy” scale and their ratings sum to 290:
What’s a good score? On a 7-point scale, aim for an average of 5.5 or higher; anything below 5 signals friction worth investigating.
Why it matters: High effort is a leading indicator of disloyalty. According to research popularized in The Effortless Experience (Gartner/CEB), 96% of customers with a high-effort service interaction become more disloyal. Use a Customer Effort Score template to track this friction, and read our full Customer Effort Score (CES) guide for tips on improving it.
Operational & Efficiency Metrics
While sentiment metrics tell you how customers feel, operational customer service metrics tell you what is happening inside your support team.
4. First Contact Resolution (FCR)
First Contact Resolution measures the percentage of tickets resolved in a single interaction—no follow-ups, no transfers, no callbacks.
- Formula:
- Worked example: If you resolve 80 of 100 tickets without any follow-up:
What’s a good score? Most teams target around 70–75%; 80%+ is excellent for complex products.
Why it matters: FCR is often cited as the metric with the biggest impact on CSAT. Customers hate repeating themselves. A high FCR indicates a knowledgeable and empowered support team. Track it alongside our first contact resolution rate guide, and measure it per conversation with live chat surveys.
5. First Response Time (FRT)
First Response Time tracks how long a customer waits before an agent acknowledges their request. This does not include automated auto-responses.
- Formula:
- Worked example: If the first responses to 100 tickets take 500 minutes in total:
What’s a good score? Aim for under 1 minute on live chat and under 1 hour on email; social channels usually expect a response within a few hours.
Why it matters: Speed matters. Even if you can’t solve the issue immediately, a quick “We’re looking into it” reduces customer anxiety and sets the tone for the whole interaction.
6. Average Resolution Time (ART)
Also known as Mean Time to Resolve (MTTR), this measures the average time elapsed from when a ticket is opened until it is closed.
- Formula:
- Worked example: If your team spends 600 minutes resolving 30 tickets:
What’s a good score? There’s no universal target—ART depends heavily on issue complexity. Track the trend and segment by issue type rather than chasing an absolute number.
Why it matters: It helps you understand the complexity of your support volume. If ART is increasing, you may have a product issue or a training gap.
7. Ticket Volume
This is simply the total number of support requests received over a given period.
- Why it matters: Tracking volume helps with staffing and capacity planning. A sudden spike in volume often indicates a bug, an outage, or a confusing new feature release.
8. SLA Compliance Rate: A Crucial Customer Service Metric
SLA (Service Level Agreement) Compliance measures the percentage of tickets that are responded to or resolved within the time limits promised to customers.
- Formula:
- Worked example: If 475 of 500 tickets are handled within the promised window:
What’s a good score? Most teams commit to 95%+ compliance; in contractual B2B settings, the threshold is often defined in the agreement itself.
Why it matters: Consistently missing SLAs breaches trust with your customers, especially in B2B relationships where these guarantees are often contractual.
9. Ticket Reopen Rate
The Ticket Reopen Rate tracks how often a customer replies to a ticket after it was marked as “solved.”
- Formula:
- Worked example: If 12 of 400 “solved” tickets are reopened:
What’s a good score? Keep it below 5%; a rising reopen rate usually points to premature closures or unresolved root causes.
Why it matters: A high reopen rate suggests that your agents are closing tickets prematurely or not fully solving the root cause, leading to customer frustration.
Business & Retention Metrics
Support is not a cost center; it is a growth engine. These metrics link service quality to the bottom line.
10. Customer Churn Rate
Churn Rate is the percentage of customers who stop doing business with you over a specific period.
- Formula:
- Worked example: If you start the month with 1,000 customers and lose 20:
What’s a good score? Lower is always better; “good” monthly churn for most B2B SaaS is under 1–2%, but it varies by segment and contract length.
Why it matters: Poor customer service is a primary driver of churn. Research by Harvard Business Review highlights that reducing churn by just 5% can increase profits by 25-95%. Dig deeper with our customer churn rate guide, learn why customers leave with a churn survey, and apply proven customer retention strategies.
11. Customer Lifetime Value (CLTV)
CLTV predicts the total revenue a business can reasonably expect from a single customer account.
- Formula:
- Worked example: A customer who spends $50 per order, buys 4 times a year, and stays for 3 years:
What’s a good score? There’s no fixed target, but a healthy business keeps CLTV well above acquisition cost—a common rule of thumb is a CLTV-to-CAC ratio of 3:1 or higher.
Why it matters: Understanding CLTV helps you decide how much to invest in retaining a customer. High-value customers may warrant a dedicated “white-glove” support tier. See how it ties into the bigger picture in our customer retention metrics guide.
12. Employee Net Promoter Score (eNPS)
Happy employees make happy customers. eNPS measures how likely your employees are to recommend your company as a place to work.
- Why it matters: Support is a high-burnout role. If your team is unhappy, that sentiment will inevitably bleed into customer interactions. Regular employee engagement surveys are crucial for maintaining a healthy service culture.
Common mistakes to avoid when tracking customer service metrics
Collecting numbers is easy; using them well is where most teams slip. Watch for these pitfalls:
- Optimizing one metric in isolation. Pushing agents to close tickets fast can wreck your FCR and reopen rate. Always read speed metrics (FRT, ART) alongside quality metrics (CSAT, reopen rate).
- Confusing correlation with causation. A CSAT dip might be a product bug, not an agent problem. Pair quantitative scores with open-text feedback to find the real driver.
- Surveying at the wrong moment. A CES survey sent days after resolution measures memory, not effort. Trigger transactional surveys immediately after the interaction.
- Ignoring response bias. If only your angriest and happiest customers respond, your averages lie. Track response rate and segment results by channel and customer tier.
- Measuring without acting. The single biggest waste is a dashboard nobody uses. Assign an owner to each metric and a threshold that triggers action.
How Responsly Helps You Measure & Improve
Tracking these customer service metrics manually via spreadsheets is impossible at scale. You need a robust feedback loop that captures data across every channel.
Responsly empowers your team to automate this entire measurement process:
Automated Post-Interaction Surveys: Trigger CSAT or CES surveys instantly via email or in-app popups after a ticket is closed.
Omnichannel Feedback: Collect data where your customers are—whether that is via WhatsApp, SMS, or directly on your website.
Advanced Analytics: Visualize your NPS and satisfaction trends over time to spot issues before they cause churn.
Employee Experience: Don’t forget your agents. Use our employee experience templates to monitor team pulse and prevent burnout.
By combining operational data from your helpdesk with sentiment data from Responsly, you get a complete 360-degree view of your customer experience.
Conclusion
Choosing the right customer service metrics depends on your current business goals. If you are a startup, focus on CSAT and FRT to build trust. As you scale, prioritize NPS and CLTV to drive long-term growth.
The most important rule? Don’t just measure—act. A metric is only useful if it leads to a decision that improves the life of your customer.
Start measuring what matters today. Explore our library of free survey templates to launch your measurement strategy in minutes.
FAQ
What are the most important customer service metrics?
How do you calculate customer service ROI?
What is the difference between CSAT and NPS?
How often should I track support KPIs?
Tagged in
Last updated