Crosstabs allow you to make better decisions based on collected data by identifying relationships between answers. They help you quickly find trends and correlations in results and are a popular choice for statistical analysis.
To create a crosstab in Responsly:
- create a survey with at least two closed questions (for example Choice or Scale),
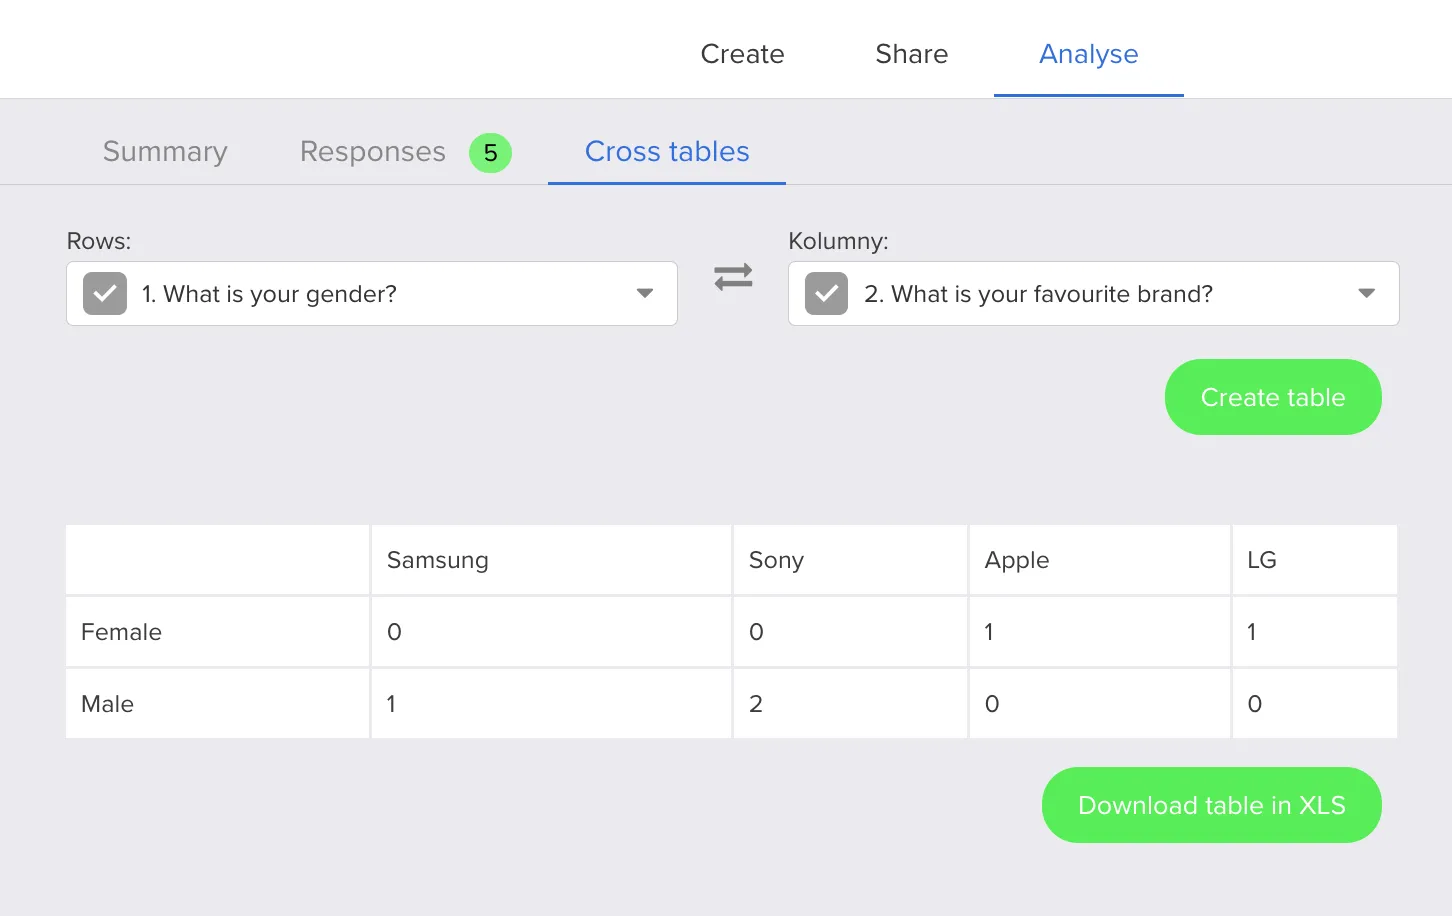
- go to the Analysis → Crosstabs tab,
- select the questions you want to cross,
- click Generate table to see a contingency table for the selected questions.
A button below the table lets you download the generated table to Excel.