Table of contents
- Key takeaways
- What is product experience (PX)?
- PX vs CX vs UX vs EX: what each acronym actually owns
- Where product experience and customer experience pull in opposite directions
- The product experience lifecycle
- Product experience metrics that matter
- How to build a product experience program
- Common product experience mistakes
- How Responsly supports product experience
- Getting started: your first 90 days
- Summary

Product experience (PX) is everything a user encounters inside your product—from signup and activation through habitual use, feature adoption, and expansion. PX is also the most contested three-letter acronym in SaaS: some define it as a subset of user experience, others as a superset, and a few use it for “people experience” entirely. This guide is for product managers, growth teams, and CX leaders who need to stop arguing about taxonomy and start assigning ownership. It covers a working definition of product experience, a decision rule for splitting PX from CX and UX, the metrics worth tracking, and where PX and customer experience genuinely conflict.
Key takeaways
- Definition: product experience is the portion of the customer relationship that happens inside the product—signup, activation, core usage, feature adoption, and expansion.
- The practical split: if you can fix it by shipping code, it is PX. If it needs a person or a channel outside the product, it is customer experience. If it is one screen’s usability, it is UX.
- PX is a component of CX, not a synonym. Teams that treat them as interchangeable end up measuring the product with survey metrics designed for the whole relationship.
- Measure both sides: behavioural metrics (activation, feature adoption, retention) tell you what happened; in-app surveys tell you why.
- The two disciplines can conflict. In-app upsells, feature deprecation, and support deflection all improve one experience metric while damaging another.
What is product experience (PX)?
Product experience is the sum of everything a user encounters within your product, and the value they get from it over time. It spans first login, the path to the activation moment, day-to-day workflows, discovery of new capability, and the decision to expand or churn. Unlike a single design review, PX is continuous and measured in aggregate.
In SaaS, this matters because the product now carries most of the relationship. Trial, purchase, onboarding, education, and renewal increasingly happen in-app rather than through a salesperson or an account manager. The product is not just what you sell; it is the primary channel through which you sell, teach, and retain.
Why the definition is contested
There is no industry consensus on where PX sits relative to UX, and the disagreement is not academic—it decides which team gets held accountable.
- The narrow view treats PX as a subset of user experience: specifically the portion of the customer journey that takes place inside an application. This is how product analytics and digital adoption vendors typically frame it.
- The broad view treats PX as larger than UX: UX covers interface and usability, while PX adds discovery, onboarding, adoption, support, and the commercial relationship around the product.
Both are defensible, and arguing about the hierarchy wastes time. What actually helps is a rule for deciding who fixes a given problem, which is what the next section provides.
Does PX mean “people experience”?
Occasionally, yes. In some HR and workplace contexts PX is used as shorthand for people experience, which overlaps almost entirely with what most organisations call employee experience. In SaaS and product management, PX means product experience nearly without exception. If a source is ambiguous, check whether it is talking about users or staff.
PX vs CX vs UX vs EX: what each acronym actually owns
Four experience disciplines, four different scopes, four different owners. The table below is the version worth pinning in a team wiki.
| Discipline | What it covers | Scope | Question it answers | Usual owner | Core metrics |
|---|---|---|---|---|---|
| Product experience (PX) | Everything inside the product | Signup → activation → habitual use → expansion | Does the product deliver value fast, and keep delivering it? | Product management, product growth | Activation rate, feature adoption, retention |
| User experience (UX) | Usability and design of specific interactions | A single flow, screen, or component | Can someone complete this task without friction? | Design, UX research | Task success rate, customer effort score |
| Customer experience (CX) | Every interaction with the company | Marketing → sales → product → support → renewal | How does it feel to be our customer overall? | CX, customer success | NPS, CSAT, churn rate |
| Employee experience (EX) | Everything an employee encounters | Job ad → onboarding → growth → exit | Is this a place where people can do good work? | HR, people operations | eNPS, voluntary turnover |
The decision rule
When something goes wrong, the fix location tells you which discipline owns it:
- Can you fix it by shipping code in the product? That is PX. Users abandoning setup, a feature nobody finds, a slow core workflow.
- Does it need a person, a policy, or a channel outside the product? That is CX. A confusing invoice, a slow support reply, a sales promise the product does not keep.
- Is it one screen or one interaction being hard to use? That is UX, and it usually resolves into a PX problem once you measure how many users hit it.
This rule is more useful than a taxonomy diagram because it maps to a backlog. It also exposes the common failure mode: a company runs a relationship-level NPS survey, sees the score drop, and asks the product team to fix it—without knowing whether the cause was inside the product at all. If you want to understand how the broader journey differs from the overall relationship, our comparison of the customer journey versus customer experience covers the same distinction one level up.
Where product experience and customer experience pull in opposite directions
Most guides present PX and CX as complementary. In practice they compete for the same surface area, and the conflicts are predictable. Naming them in advance is what stops teams from optimising one metric into another team’s problem.
- In-app upsell prompts. Expansion campaigns delivered in-product reliably lift revenue in the quarter they launch, and just as reliably degrade the experience of users who are not buying. The CX team sees a satisfaction dip with no obvious cause; the growth team sees a win. Both readings are correct.
- Deprecating low-adoption features. Removing rarely used functionality simplifies the product for the majority—a clear PX gain—while being a severe CX failure for the minority who built a workflow on it. The right call is usually to deprecate, but the cost lands on a different team than the benefit.
- Support deflection. Routing users to in-product help instead of a human improves self-service metrics and reduces ticket volume. For users whose problem genuinely needed a person, effort goes up and the relationship suffers.
- Onboarding length. Shorter onboarding raises activation rate. Longer onboarding produces better-configured accounts that retain more. Optimising the first number in isolation can quietly damage the second.
The pattern: PX metrics are measured per session or per feature; CX metrics are measured per relationship. A change can improve the first and damage the second for months before anyone connects them.
The way out is not to pick a winner but to instrument both and review them together. When a product change ships, watch activation and adoption alongside NPS and support volume, and treat a divergence as a finding rather than noise. Closing the loop with the users affected—see our guide to the closed feedback loop—is what turns that finding into a decision.
The product experience lifecycle
Product experience is easiest to manage when broken into stages, because each one fails differently and needs a different fix.
| Stage | The user’s question | What to measure | Typical intervention |
|---|---|---|---|
| Discovery and evaluation | Is this built for a problem like mine? | Trial signup rate, demo-to-trial rate | Clearer positioning, product screenshots, transparent pricing |
| Signup and setup | How much work before I see anything useful? | Signup completion, setup drop-off | Fewer required fields, sensible defaults, sample data |
| Activation | Did I get the thing I came for? | Activation rate, time-to-value | Guided path to one core action, not a feature tour |
| Core usage | Is this faster than what I did before? | Weekly active use, task completion | Workflow and performance work, keyboard shortcuts, integrations |
| Feature adoption | What else is in here that I need? | Feature adoption rate, breadth of use | Contextual discovery at the moment of need |
| Expansion or churn | Is this still worth paying for? | Retention, expansion revenue, churn | Value reporting, churn surveys, proactive outreach |
Two stages deserve extra attention. Activation is where most products lose users, and the goal is narrow: get someone to the one action that delivers your core value, not through a tour of everything you built. Feature adoption is where most products waste engineering budget, which the next section quantifies.
Product experience metrics that matter
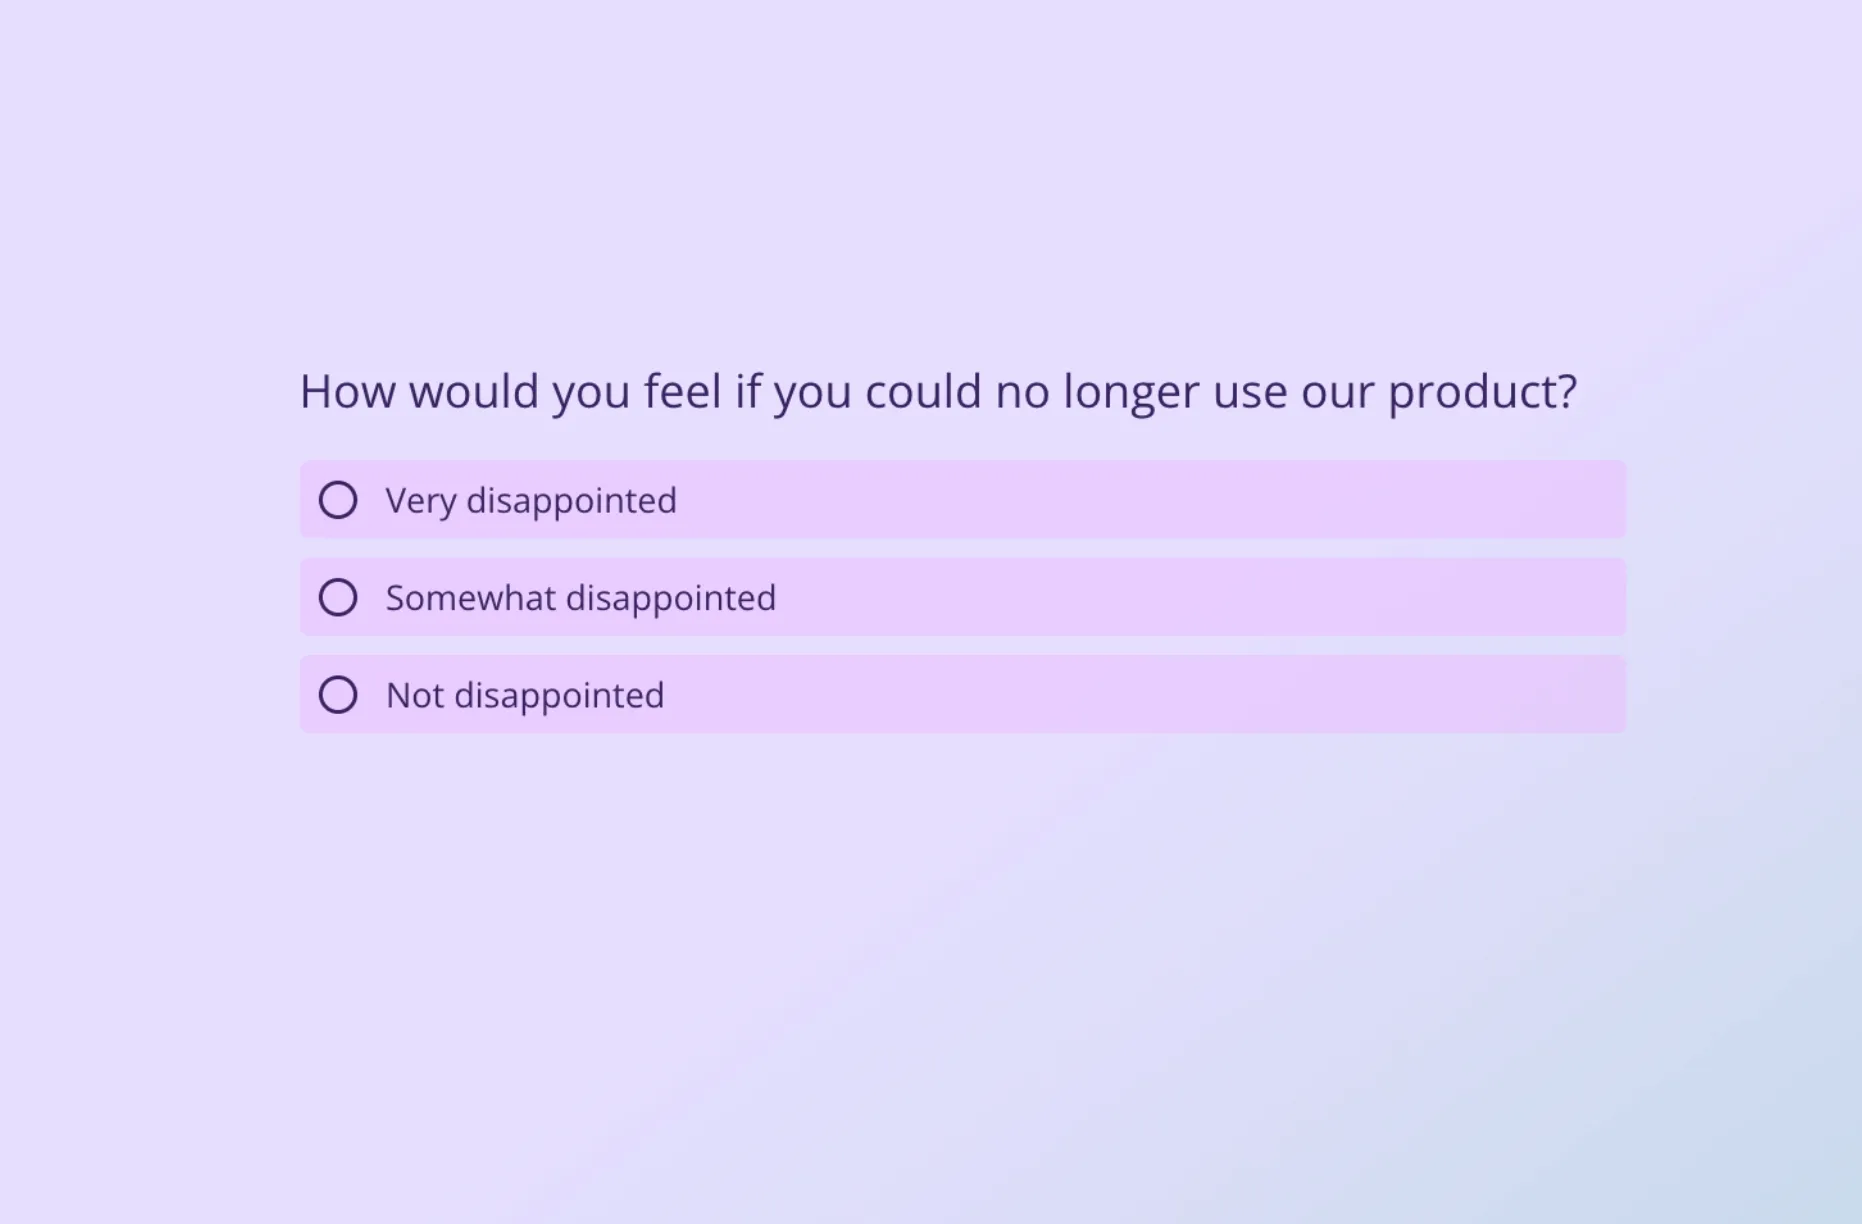
Product experience needs two kinds of measurement. Behavioural analytics show what users did. Asked feedback explains why. Running only the first leaves you guessing at motive; running only the second leaves you with opinions and no denominator.
| Metric | What it measures | How to calculate | When to use it |
|---|---|---|---|
| Activation rate | Share of signups reaching your core value moment | Activated users / total signups × 100 | Continuously; the single best early health signal |
| Time-to-value (TTV) | How long until a user gets the core benefit | Median time from signup to activation event | When activation is high but retention is weak |
| Feature adoption rate | Share of active users using a given feature | Users of feature / active users × 100 | After every release, by segment |
| Product-Market Fit score | How essential the product is to users | % answering “very disappointed” | Quarterly, on users past activation |
| NPS | Loyalty and likelihood to recommend | % Promoters − % Detractors | Relationship level, not per feature |
| CES | How hard a specific task was | Average effort rating after a task | Immediately after a key workflow |
| Retention rate | Share of users still active after a period | Active at end / cohort size × 100 | Cohort by cohort, monthly |
The two formulas worth standardising across teams:
For the Product-Market Fit score, the widely used benchmark is that 40% or more of users answering “very disappointed” indicates genuine fit. Our guide on how to measure product-market fit with surveys covers question wording and sampling.
One warning on benchmarks: adoption rates vary enormously by feature type and company size, so a borrowed number is close to meaningless. Use your own baseline and measure the direction of travel.
How to build a product experience program

Step 1: Define the activation moment
Identify the single action that correlates with retention, then work backwards. Look at what retained users did in their first session or week that churned users did not. Without this definition, every other metric floats.
Step 2: Instrument the lifecycle
Map where users drop off between each stage in the table above. You are looking for the largest single drop, not a complete picture.
Step 3: Segment before you conclude
Aggregate numbers hide the answer. Split by use case, role, company size, and lifecycle stage—see user segmentation methods for a practical approach. A 20% activation rate that is 45% for one segment and 6% for another is a positioning problem, not an onboarding problem.
Step 4: Ask why, in context
Behavioural data cannot tell you motive. Trigger short in-app surveys at the moments that matter: after setup, after first use of a key feature, and when usage drops. A focused feature feedback survey beats a long quarterly questionnaire nobody finishes.
Step 5: Close the loop and ship
Report back what changed and why. Users who see their feedback acted on respond to the next survey; users who do not, stop answering. This is the difference between a feedback program and a survey habit.
Common product experience mistakes
Shipping features nobody adopts. Feature bloat is the most expensive PX failure. Research from Pendo across its installed base has repeatedly found that around 80% of features in the average software product are rarely or never used. Measure adoption per feature before building the next one.
Optimising signups over activation. Top-of-funnel growth flatters a dashboard and does nothing for revenue if users never reach value.
Assuming the product is intuitive. It is intuitive to the team that built it. Watch a new user attempt setup unaided before making that claim.
Treating all users as one segment. A single onboarding path for an admin, an analyst, and an end user underserves all three.
Collecting feedback without acting. Asking and ignoring is worse than not asking; it teaches users their input is decorative.
Neglecting existing users. Obsessing over new-user onboarding while power users hit unfixed friction is how products lose their advocates.
How Responsly supports product experience
Most product teams already have analytics telling them what users did. The gap is understanding why, fast enough to act. Responsly is an AI-powered customer feedback platform built for that half of the problem.
- In-app and website surveys triggered at the exact moment that matters—after setup, after first use of a feature, or when a user shows churn signals—rather than a quarterly email nobody opens.
- Non-annoying by design. Short, contextual microsurveys that respect the session the user is in, which is what keeps response rates workable inside a product.
- Omnichannel reach through survey distribution across email, SMS, WhatsApp, link, and QR, so you can reach users who have already stopped logging in—usually the ones with the most to say.
- Athena, our AI agent, reads open-ended responses at scale, groups them into recurring themes, flags emerging churn risk, and produces a report you can take to a roadmap review. This is the step that normally consumes a week of manual tagging.
- Feedback analytics that connect PX and CX signals in one place, so you can see activation and adoption alongside NPS and CSAT instead of in separate tools.
- Ready-made templates including a product feedback survey and a user satisfaction survey to launch in minutes.
See how product teams use Responsly to guide the roadmap, or how CX teams run the relationship-level programs alongside it. If you are evaluating tooling more broadly, our comparison of the best product experience software covers the analytics and digital adoption categories too.
Getting started: your first 90 days
Days 1–30 — establish the baseline. Define your activation moment, instrument it, and measure activation rate and time-to-value for the last three cohorts. Identify the single largest drop-off in the lifecycle.
Days 31–60 — find out why. Launch two in-app surveys: one triggered after setup, one triggered on the drop-off point you found. Segment the results before drawing conclusions.
Days 61–90 — ship and close the loop. Make one change to the biggest friction point, measure the same metrics against the previous cohort, and tell the users who reported the issue what you changed.
Summary
Product experience is not a rebrand of UX and not a subset of CX marketing. It is the discipline of making the product itself deliver value quickly and repeatedly, owned by the team that can ship the fix. The teams that do this well are not the ones with the most dashboards—they are the ones who defined an activation moment, measured the drop-off honestly, and asked users why in the moment it happened.
Start with one metric and one question. Define what activated means for your product, find the largest gap between signup and that moment, and ask the users who did not make it what stopped them. Everything else in this guide is a refinement of that loop—and a working feedback loop is how teams accelerate product innovation.
Ready to understand your product experience? Create a free Responsly account and launch your first in-app survey today.
FAQ
What is the difference between product experience and user experience?
What is the difference between product experience and customer experience?
Does PX stand for product experience or people experience?
How do you measure product experience?
Who owns product experience in a company?
What is a product experience platform?
Tagged in
Last updated